Grafana
What is Grafana ? From their homepage
 grafana.com :
Used by thousands of companies to monitor everything from infrastructure, applications, and power plants to beehives.
They have an online demo to browse and play:

Preparation
Prerequisites are:
 Prometheus for data aquisition / scraping
- Helm (already installed for Prometheus)
- A storage provisioner to fullfill storage claims (e.g.
NFS Storage) (already installed for Prometheus)
Installation
Grafana installation and configuration involves a couple of steps and there are multiple ways to do it.
- install grafana and its components
- configuring datasource(s) and provider(s)
- installing dashboards
In many cases you may want to only install the basic grafana and then configure/install datasources and dashboards
through the Grafana ui. There are so many options from very easy to very complex and there is also a
public catalog of dashboards.
These installation steps try to keep the manual effort as low as possible and
will install some dashboards known to work in the context of this tutorial. We will use the

 grafana/grafana
chart.
grafana/grafana
chart.
cd ~/homekube/src/grafana

kubectl create namespace grafana

helm repo add grafana https://grafana.github.io/helm-charts

# provide default admin credentials e.g. admin/admin1234
kubectl create secret generic grafana-creds -n grafana \
  --from-literal=admin-user=admin \
  --from-literal=admin-password=admin1234

helm install grafana -n grafana --version=6.42.2 \
-f datasource-dashboards.yaml \
--set persistence.enabled=true \
--set persistence.storageClassName=managed-nfs-storage \
--set admin.existingSecret=grafana-creds \
grafana/grafana
Actually a lot of configuration details are “hidden” in the datasource-dashboards.yaml. See the comments there.
We enable persistence and set a storage class. We also provide credentials of our choice for the admin user.
Installer response:
NAME: grafana
LAST DEPLOYED: Sun Nov 14 15:02:10 2021
NAMESPACE: grafana
STATUS: deployed
REVISION: 1
NOTES:
1. Get your 'admin' user password by running:

   kubectl get secret --namespace grafana grafana -o jsonpath="{.data.admin-password}" | base64 --decode ; echo

2. The Grafana server can be accessed via port 80 on the following DNS name from within your cluster:

   grafana.grafana.svc.cluster.local

   Get the Grafana URL to visit by running these commands in the same shell:

     export POD_NAME=$(kubectl get pods --namespace grafana -l "app.kubernetes.io/name=grafana,app.kubernetes.io/instance=grafana" -o jsonpath="{.items[0].metadata.name}")
     kubectl --namespace grafana port-forward $POD_NAME 3000

3. Login with the password from step 1 and the username: admin
Before we follow the installers instructions lets first check if the installation was successful.
kubectl get po -n grafana --watch
Depending on the number of pre-configured dashboards it can take quite a while until all the dashboards are configured and grafana shows STATUS Running and READY 1/1:
NAME                       READY   STATUS    RESTARTS   AGE
grafana-6cb8cb8f8f-gtbl6   1/1     Running   0          22m
If you see STATUS CrashLoopBackoff or another status for some time then consult the
troubleshooting tips.
Lets follow the installers instructions:
1) Get your ‘admin’ user password …
We can ignore this because the password was already supplied in the kubectl create secret ... instruction.
Unfortunately the message prompt
is not accurate.
2) Execute the instructions but note the appended –address=0.0.0.0
export POD_NAME=$(kubectl get pods --namespace grafana -l "app.kubernetes.io/name=grafana,app.kubernetes.io/instance=grafana" -o jsonpath="{.items[0].metadata.name}")
kubectl --namespace grafana port-forward $POD_NAME 3000 --address=0.0.0.0
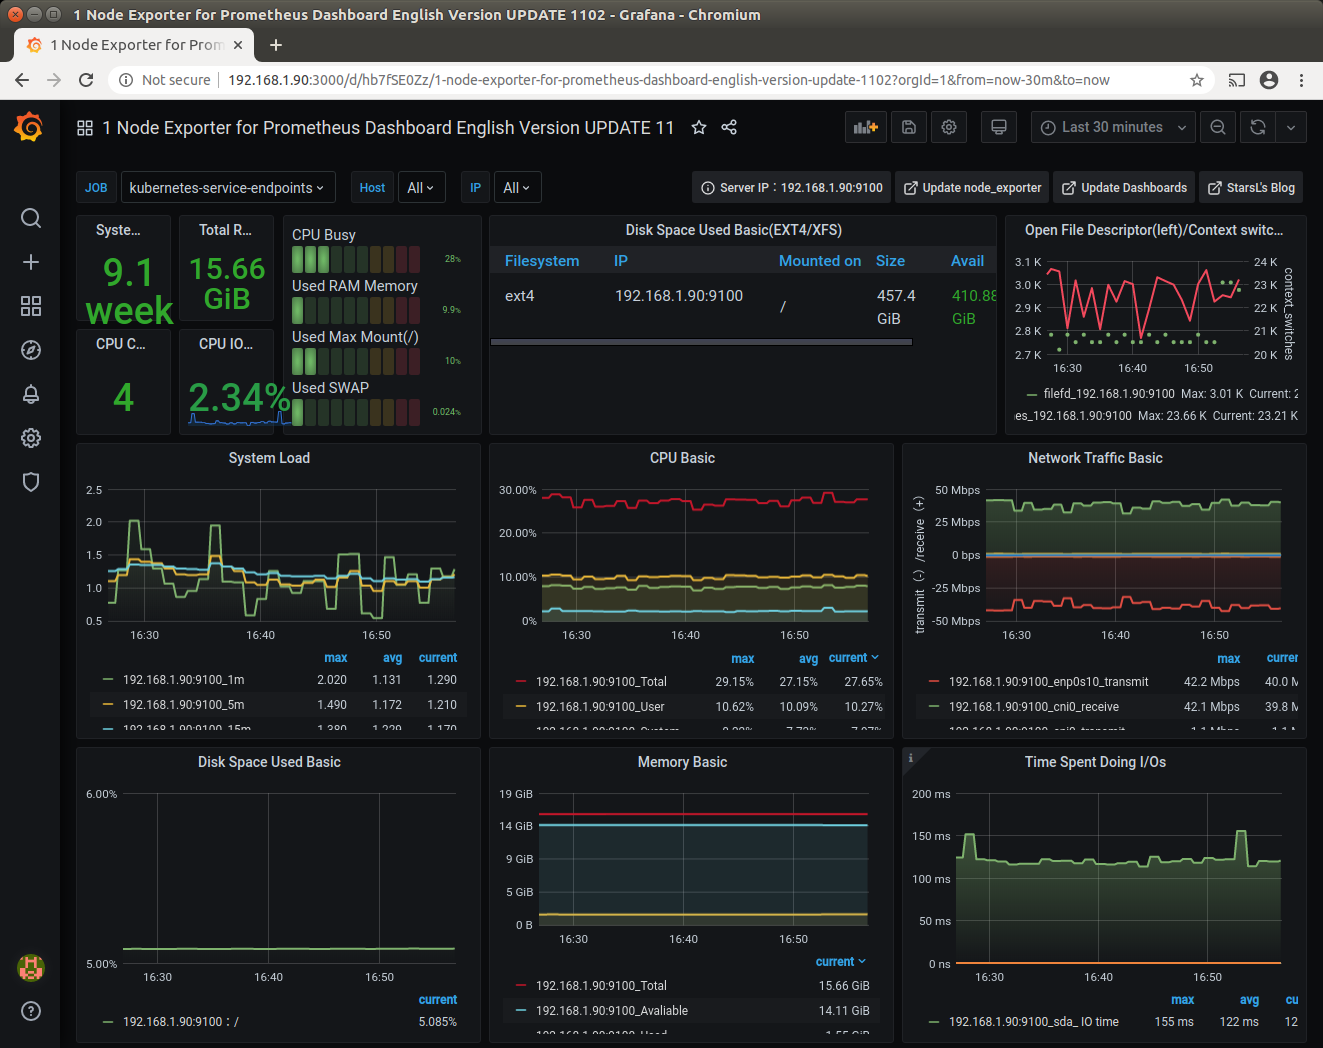
Next open a browser on http://192.168.1.100:3000 login and explore the grafana dashboard.
In the topmost bar click on Home and from the selection pick
1 Node Exporter for Prometheus Dashboard English Version
Public Exposure
Optionally deploy the Grafana UI as an Ingress to the public. We do it here for the purpose of demonstration but of course in general thats not recommended for security reasons.
kubectl apply -f ~/homekube/src/grafana/ingress-grafana.yaml
Now access
 https://grafana.homekube.org
with demo/demo credentials and browse the dashboard.
https://grafana.homekube.org
with demo/demo credentials and browse the dashboard.
Cleanup
In case you want to remove the installation (e.g. reinstall ….)
helm uninstall grafana -n grafana
kubectl delete namespace grafana
helm list --all-namespaces
Next steps
Browse and check the options of your grafana dashboard. Then you might want to explore the
workload behaviour of your cluster.

 34:09 Prometheus monitoring for Kubernetes Cluster and Grafana visualization