Workload testing
Test your installations response times and payload stability
Preparation
Prerequisites are:
cd ~/homekube/src/test/workload
Now lets explore our installed instrumentation with some simple tests. There are plenty of ‘hello-world’
containers available and for our tests it should be configurable to simulate different load conditions
and response times. This one  containous/whoami
returns the request header and also can be easily parametrized for a delayed response
containous/whoami
returns the request header and also can be easily parametrized for a delayed response /?wait=50ms or
to add some payload to the response /data?size=10000
Installation
kubectl create namespace test-workload
kubectl create deployment whoami --image=containous/whoami -n test-workload
kubectl expose deployment whoami --type=NodePort --port=80 -n test-workload
kubectl get service whoami -n test-workload
In the test-workload namespace we deploy the container and expose it as a service. Note that
--type=NodePort allows us to test the installed container directly e.g. not just via ingress so to confirm
that it is properly installed.
NAME     TYPE       CLUSTER-IP      EXTERNAL-IP   PORT(S)        AGE
whoami   NodePort   10.152.183.34   <none>        80:32601/TCP   161m
The response from kubectl get service whoami -n test-workload
shows us the exposed NodePort - in this example 32601.
Now execute from a local terminal
curl 192.168.1.100:32601
and the response should be like
Hostname: whoami-589c447684-wwf2j
IP: 127.0.0.1
IP: ::1
IP: 10.1.88.35
IP: fe80::98e3:ceff:feed:3be6
RemoteAddr: 10.1.88.1:41338
GET / HTTP/1.1
Host: 192.168.1.100:32601
User-Agent: curl/7.58.0
Accept: */*
Ok, the testing container is properly working so as the next step we will expose it as an ingress.
kubectl apply -f whoami-ingress.yaml
Actually we are exposing it twice under the host addresses who-am-i.org and who-am-i.info so we can put
different workloads on both addresses and watch the differences in Grafana. Its important to note
that Ingresses must be configured in the same namespace hence the namespace test-workload must
be defined in the definition file.
Now lets check if the ingress works. We need to direct our request now to the Ingress which is available
through the public ip assigned to our MetalLb (see  Ingress config).
From a local terminal
curl -X GET 192.168.1.200 -H 'host: who-am-i.info'
Hostname: whoami-589c447684-wwf2j
IP: 127.0.0.1
IP: ::1
IP: 10.1.88.35
IP: fe80::98e3:ceff:feed:3be6
RemoteAddr: 10.1.88.11:59460
GET / HTTP/1.1
Host: who-am-i.org
User-Agent: curl/7.58.0
Accept: */*
X-Forwarded-For: 10.1.88.1
X-Forwarded-Host: who-am-i.info
X-Forwarded-Port: 80
X-Forwarded-Proto: http
X-Real-Ip: 10.1.88.1
X-Request-Id: dfa50b04b25b9ab10c398275f3a74db0
X-Scheme: http
Testing
Check proper scraping
Next lets make sure that prometheus is actually scraping all the required metrics.
Open the Prometheus ui
and when searching for nginx metrics it should look like this
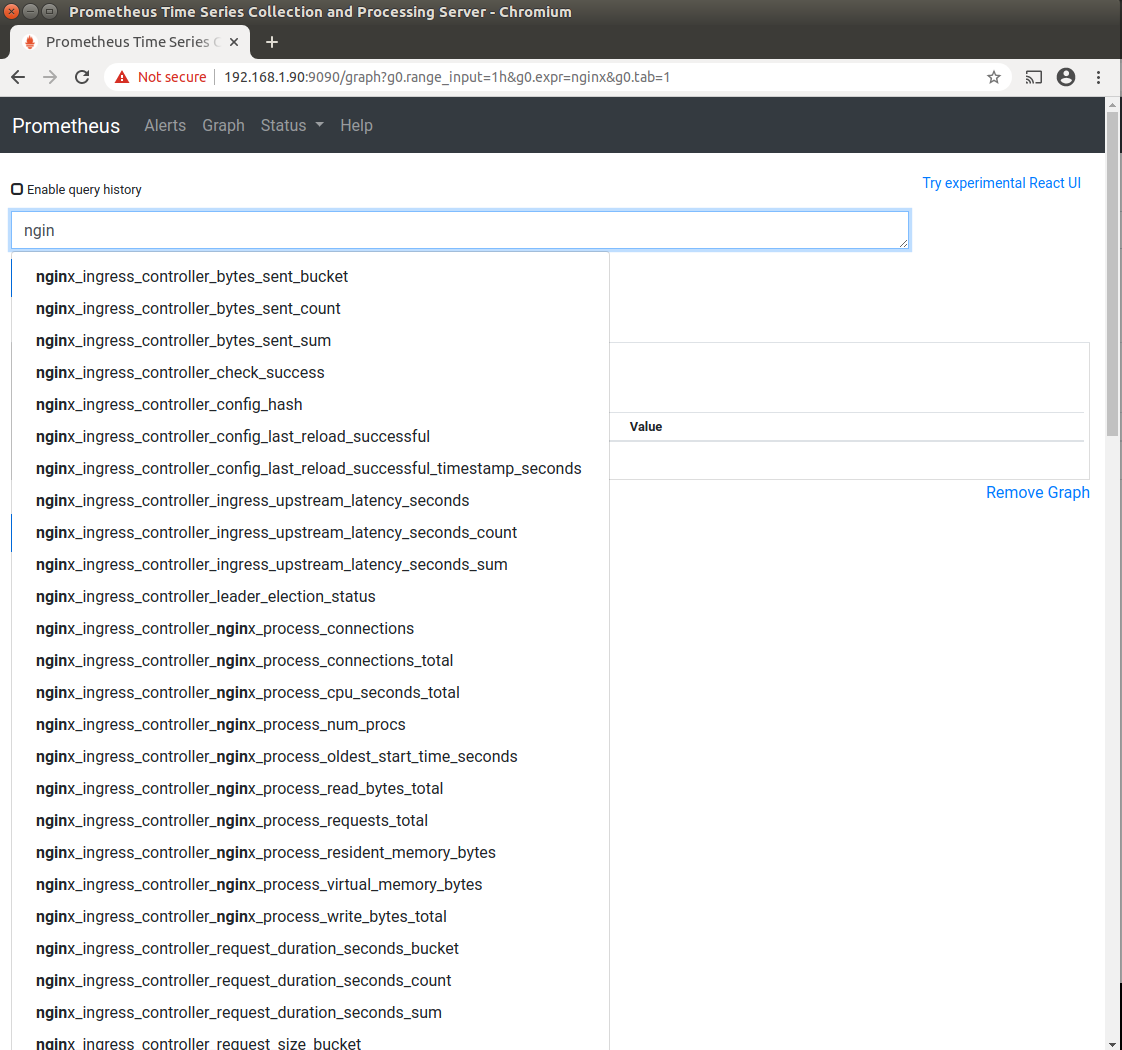
There should be a long list metrics being exposed including some containing the words "bucket".
Unfortunately there are a couple of issues that might have been gone wrong:
- If you don’t see any nginx metrics at all then nginx controller is possibly not configured for scraping.
We have done that already previously during
Ingress config
- If you only see some metrics e.g. no metrics containing
"bucket"then Prometheus probably needs to be reinstalled. Prometheus configuration omits some important nginx metrics in case it does not find any Ingress host configuration during installation. That may actually be the case when following all the installation steps in the recommended order because now for the first time we have configured an ingress host address (who-am-i.organdwho-am-i.info). In this case just do ahelm uninstall ...andhelm install ...again following the Prometheus instructions.
Providing testloads
We provide 2 testloads one for each of the configured endpoints. Open two local terminals and execute
while true; do curl -X GET 192.168.1.200/?wait=10ms -H 'host: who-am-i.info'; done
We are requesting the who-am-i.info host with with a given latency of ~10ms.
In the other terminal execute the request for host who-am-i.org with a latency of ~100ms.
while true; do curl -X GET 192.168.1.200/?wait=100ms -H 'host: who-am-i.org'; done
Explore Grafana
If not done already you’ll need to expose Grafana as a service e.g. using port-forwarding.
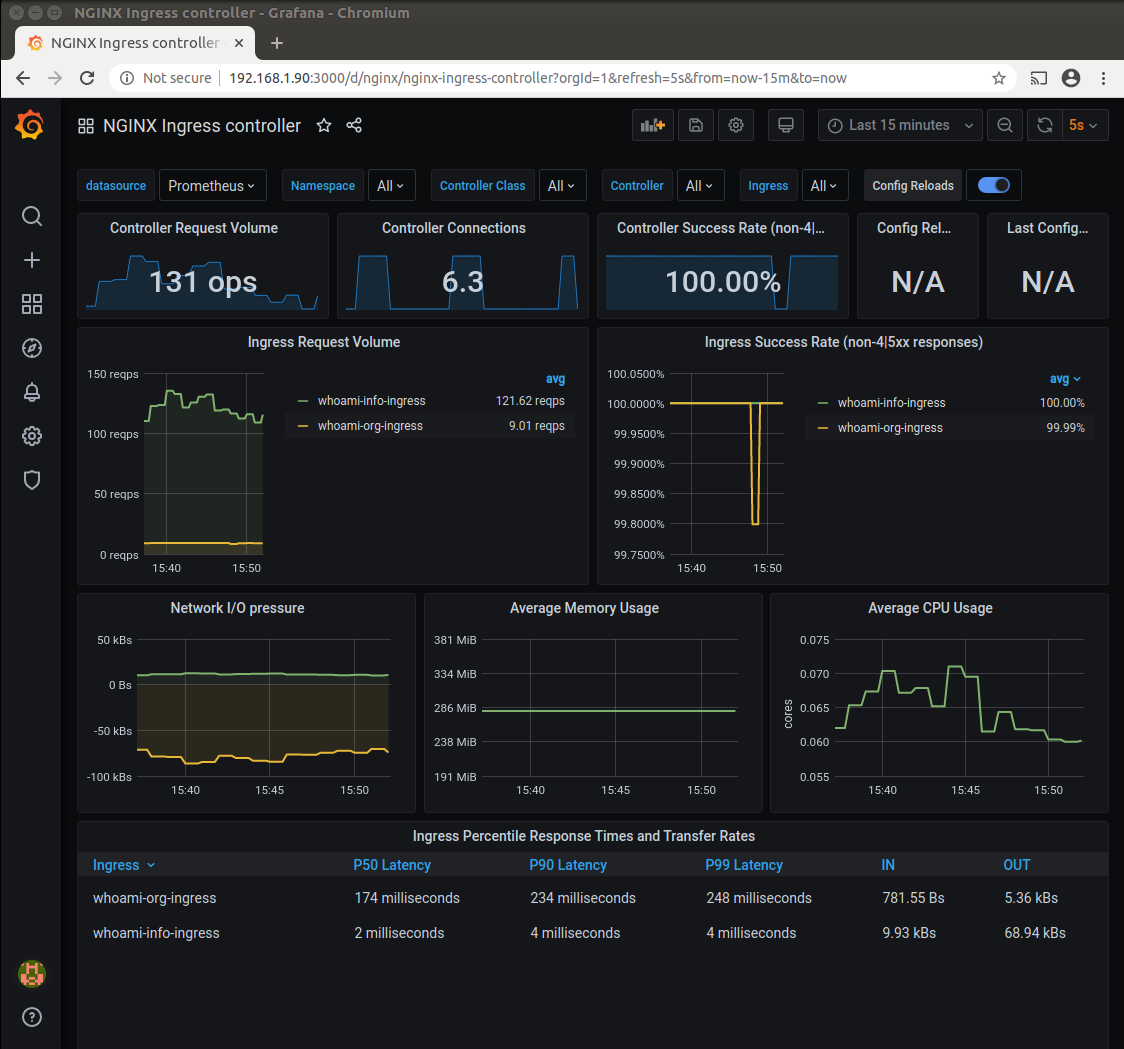
In the upper bar in Grafana select the NGINX Ingress controller dashboard.
Thats the primary nginx dashboard as it is defined by the nginx.json on the

 Nginx dashboards
page. You see the different workloads for both Ingress. In the lower dashboard section there are 3 different percentiles visible.
The
Nginx dashboards
page. You see the different workloads for both Ingress. In the lower dashboard section there are 3 different percentiles visible.
The P50 Latency e.g. shows the latency for 50% of the requests. In the Ingress Request Volume we see the
different Request per second reqps rates.
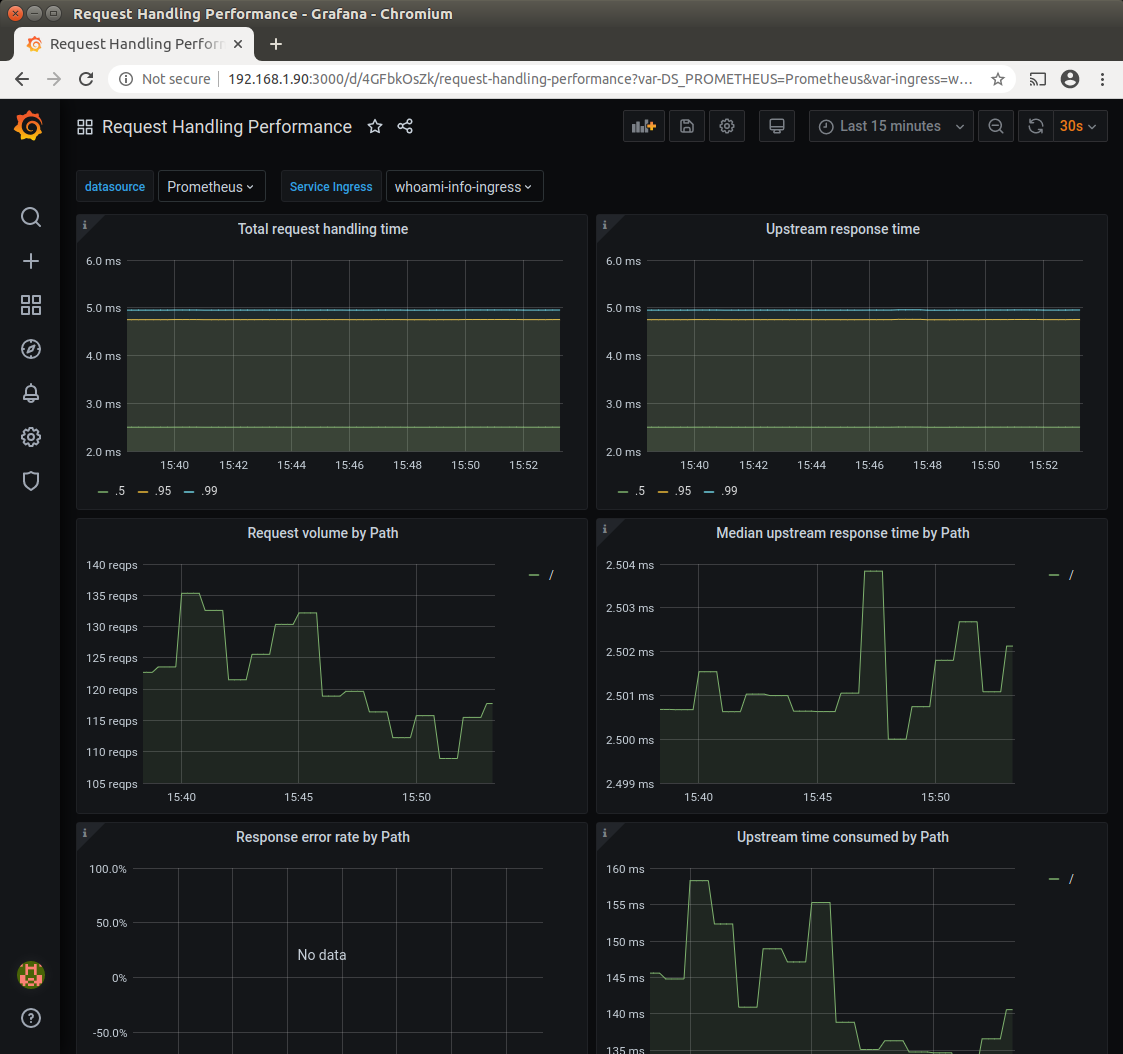
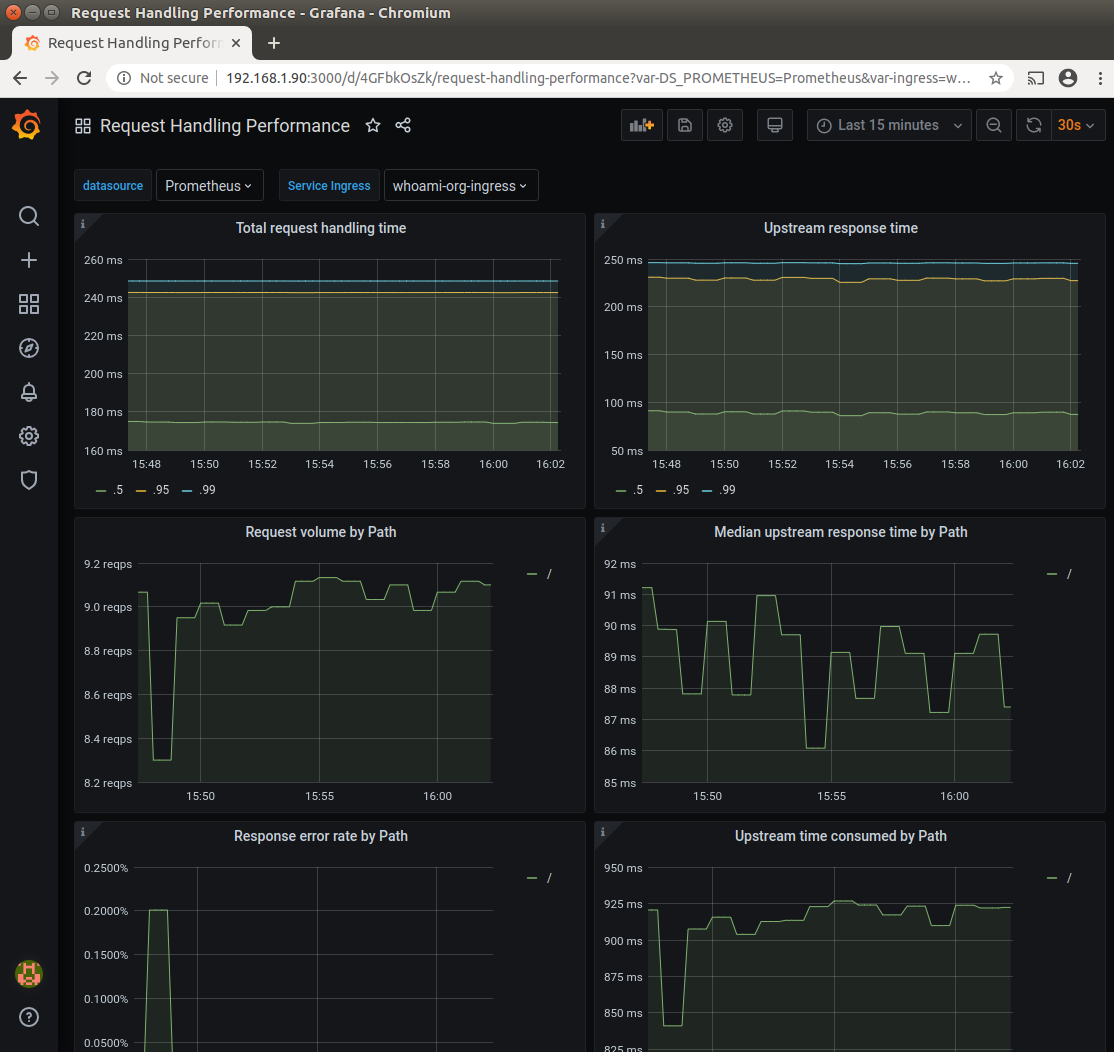
The next screenshot shows Request Handling performance dashboard with whoami-info-ingress service selected.
This dashboard is defined by the request-handling-performance.json on the
Nginx dashboards
page with some minor modifications. We replaced the time-period occurrences [1m] with a longer period [2m] because
the original settings did not provision the view reliably and instead showed the no data markers.
This screenshot shows the same dashboard again but with whoami-org-ingress service selected. Note the different volume and
time period scales as expected from the different workloads.
Now lets change the workload to ~100kb and see if our dashboards will reflect the changes
while true; do curl -X GET 192.168.1.200/data?size=100000 -H 'host: who-am-i.org'; done
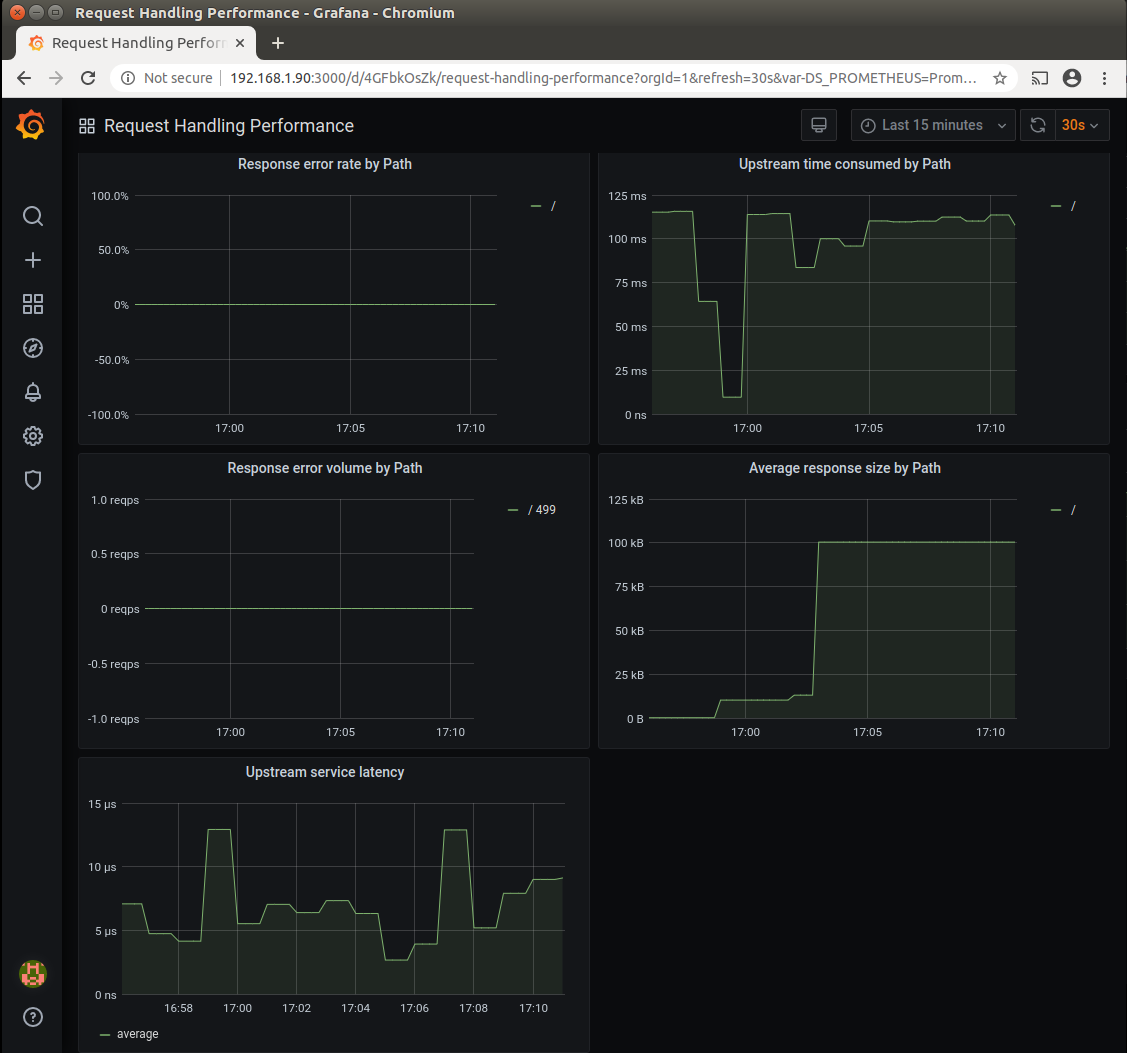
The screenshot shows that the Average response size by path rose to ~100kb - thats exactly the expected amount.